Analyzing metabolic interactions
Whereas the default results will show you which taxon consumes and produces which metabolite it is not immediately apparent which metabolic interactions that implies. Thus, we provide some helpers to quantify and summarize metabolic interactions between taxa.
It should be noted that MICOM provides mechanistic interactions, thus they differ quite abit from correlations. First, they are calculated on a per sample basis and can thus differ between samples as well. They are also non-symmetric and directed and thus qualify as ecological interactions. The strategy used in grow workflow might also affect the predicted interactions. The most conservative (least interactions) will be predicted with parsimonious FBA because it will also minimize
inter-taxon fluxes. The other strategies are somewhat more permissive for inter-taxon fluxes but may also include futile cycles (which will not appear in parsimonious FBA).
Finally all-versus-all interactions can be somewhat slow for larger data sets due to the inherent combinatorial explosion. The complexity will scale with \(n_{samples} \cdot n^2_{taxa} \cdot n_{metabolites}\).
Calculating focal interactions
Interactions are obatined from a GrowthResults object as obtained by the grow workflow. By default they are based on a single taxon of interest (called a focal taxon) for which we will calculate all metabolic interactions with all other taxa in all samples. MICOM stratifies interactions into 3 ecological types shown below.
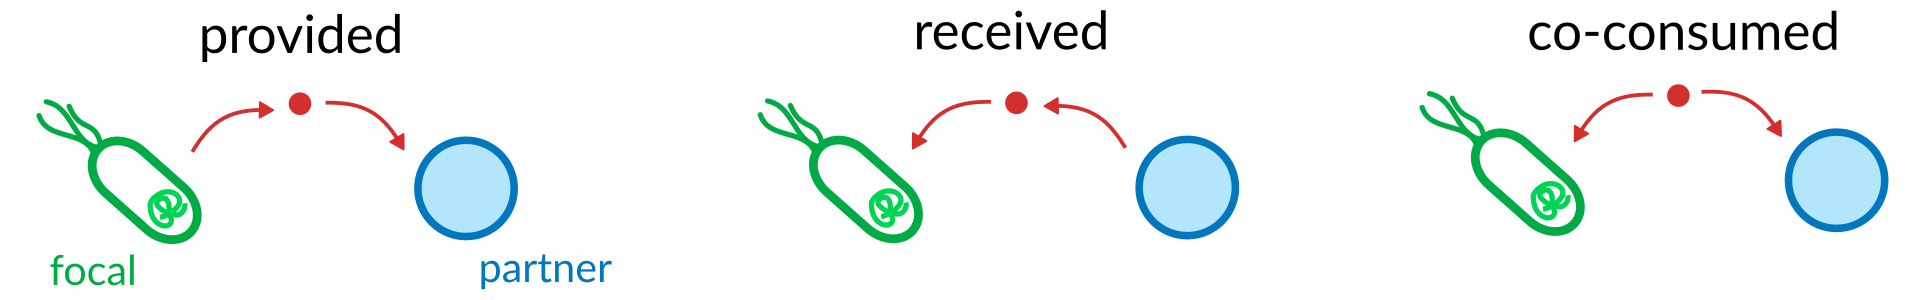
Let’s see what that looks like by using a larger example result.
[1]:
from micom.data import test_results
from micom.interaction import interactions

results = test_results()
ints = interactions(results, taxa="s__Akkermansia_muciniphila")
ints.sort_values(by="flux", ascending=False).head()
[1]:
| metabolite | focal | partner | class | flux | sample_id | name | molecular_weight | C_number | N_number | ... | kegg.compound | lipidmaps | metanetx.chemical | pubchem.compound | reactome | sbo | seed.compound | chebi | smiles | reaction | |
|---|---|---|---|---|---|---|---|---|---|---|---|---|---|---|---|---|---|---|---|---|---|
| 2115 | ala_L[e] | s__Akkermansia_muciniphila | s__Bacteroides_fragilis | provided | 11.238551 | S_SRR5935812 | L-alanine | 89.09318 | 3 | 1 | ... | C00041 | NaN | MNXM1105732 | 5950.0 | NaN | SBO:0000247 | cpd00035 | CHEBI:16977 | NaN | EX_ala_L(e) |
| 2141 | lac_D[e] | s__Akkermansia_muciniphila | s__Bacteroides_fragilis | provided | 11.141526 | S_SRR5935812 | D-lactate | 89.07000 | 3 | 0 | ... | C00256 | NaN | MNXM731835 | 61503.0 | NaN | SBO:0000247 | cpd00221 | CHEBI:42111 | NaN | EX_lac_D(e) |
| 1080 | acald[e] | s__Akkermansia_muciniphila | s__Escherichia_coli | received | 9.277781 | S_SRR5935769 | Acetaldehyde | 44.05256 | 2 | 0 | ... | C00084 | NaN | MNXM75 | 177.0 | NaN | SBO:0000247 | cpd00071 | CHEBI:15343 | NaN | EX_acald(e) |
| 1120 | pro_L[e] | s__Akkermansia_muciniphila | s__Escherichia_coli | received | 9.208372 | S_SRR5935769 | L-proline | 115.13046 | 5 | 1 | ... | C00148;C000763 | NaN | MNXM114 | 145742.0 | NaN | SBO:0000247 | cpd00129 | CHEBI:17203 | NaN | EX_pro_L(e) |
| 1094 | etoh[e] | s__Akkermansia_muciniphila | s__Escherichia_coli | received | 8.980545 | S_SRR5935769 | Ethanol | 46.06844 | 2 | 0 | ... | C00469 | NaN | MNXM734299 | 702.0 | NaN | SBO:0000247 | cpd00363 | CHEBI:16236 | NaN | EX_etoh(e) |
5 rows × 24 columns
So you see the individual metabolite flux between the pair of taxa and the interaction class in each single sample. This is quite detailed and can tell you a lot, but we can also summarize it to the overall fluxes between two taxa in a sample.
[2]:
from micom.interaction import summarize_interactions

summary = summarize_interactions(ints)
summary.head()
[2]:
| sample_id | focal | partner | class | flux | mass_flux | C_flux | N_flux | n_ints | |
|---|---|---|---|---|---|---|---|---|---|
| 0 | S_SRR5935769 | s__Akkermansia_muciniphila | s__Alistipes_finegoldii | co-consumed | 7.349260 | 0.535659 | 16.389235 | 2.699664 | 8 |
| 1 | S_SRR5935769 | s__Akkermansia_muciniphila | s__Alistipes_finegoldii | provided | 3.180756 | 0.342653 | 13.209727 | 2.560137 | 6 |
| 2 | S_SRR5935769 | s__Akkermansia_muciniphila | s__Alistipes_finegoldii | received | 1.513632 | 0.321052 | 13.030612 | 2.967128 | 6 |
| 3 | S_SRR5935769 | s__Akkermansia_muciniphila | s__Alistipes_onderdonkii | co-consumed | 2.329465 | 0.259526 | 8.734520 | 1.738114 | 8 |
| 4 | S_SRR5935769 | s__Akkermansia_muciniphila | s__Alistipes_onderdonkii | provided | 0.906143 | 0.112754 | 5.490118 | 0.764795 | 4 |
This calculates the overall flux in each class for the pair of taxa. It also provides some more meaningful eestimates of flux such as the exchanged mass, carbon or nitrogen. So in this example you see that Akkermansia competes for most of the mass with Alistipes but actually receives more nitrogen from Alistipes than it competes for in that sample.
Calculating all interactions
It’s also possible to calculate all interactions, just be aware that this (1) generates a lot of data and (2) will take a while for larger data sets. You can parallelize the analysis over each taxon by providing the the threads argument. Simply provide None for the taxa to obtain all interactions.
[3]:
full = interactions(results, taxa=None, threads=8)
full.shape
[3]:
(1115688, 24)
This generates quite a lot of results, but we can again use a summary.
[4]:
full_summary = summarize_interactions(full)
full_summary.shape
[4]:
(117108, 9)
Metabolic Exchange Score
For a slightly more global view on exchanges we also provide calculation of the Metabolic Exchange Score (MES) by Marcelino et al., which is decribed in detail here. The MES is the geometric mean of the number of producers P and consumers C of a metabolite m in a single sample i, given by:
This can be interpreted as a normalized number of all observed metabolic interactions (becuse \(P\cdot C\) is the number of all possible directed combinations of producers and consumers). So it is a measure of cross-feeding.
It can also be calculated very fast for large data sets, so let’s go.
[5]:
from micom.interaction import MES

scores = MES(results)
scores.head()
[5]:
| metabolite | sample_id | MES | name | molecular_weight | C_number | N_number | bigg.metabolite | biocyc | hmdb | ... | kegg.compound | lipidmaps | metanetx.chemical | pubchem.compound | reactome | sbo | seed.compound | chebi | smiles | reaction | |
|---|---|---|---|---|---|---|---|---|---|---|---|---|---|---|---|---|---|---|---|---|---|
| 0 | 12dhchol[e] | S_SRR5935769 | 4.800000 | 12-Dehydrocholate | 405.54758 | 24 | 0 | 12dhchol | NaN | NaN | ... | NaN | NaN | NaN | NaN | NaN | SBO:0000247 | NaN | NaN | NaN | EX_12dhchol(e) |
| 1 | 12dhchol[e] | S_SRR5935812 | 4.800000 | 12-Dehydrocholate | 405.54758 | 24 | 0 | 12dhchol | NaN | NaN | ... | NaN | NaN | NaN | NaN | NaN | SBO:0000247 | NaN | NaN | NaN | EX_12dhchol(e) |
| 2 | 12dhchol[e] | S_SRR5935816 | 3.428571 | 12-Dehydrocholate | 405.54758 | 24 | 0 | 12dhchol | NaN | NaN | ... | NaN | NaN | NaN | NaN | NaN | SBO:0000247 | NaN | NaN | NaN | EX_12dhchol(e) |
| 3 | 12dhchol[e] | S_SRR5935843 | 4.444444 | 12-Dehydrocholate | 405.54758 | 24 | 0 | 12dhchol | NaN | NaN | ... | NaN | NaN | NaN | NaN | NaN | SBO:0000247 | NaN | NaN | NaN | EX_12dhchol(e) |
| 4 | 12dhchol[e] | S_SRR5935924 | 4.444444 | 12-Dehydrocholate | 405.54758 | 24 | 0 | 12dhchol | NaN | NaN | ... | NaN | NaN | NaN | NaN | NaN | SBO:0000247 | NaN | NaN | NaN | EX_12dhchol(e) |
5 rows × 21 columns
All of the computed interaction measures also have matching visualizations.